


 15 / 77

15
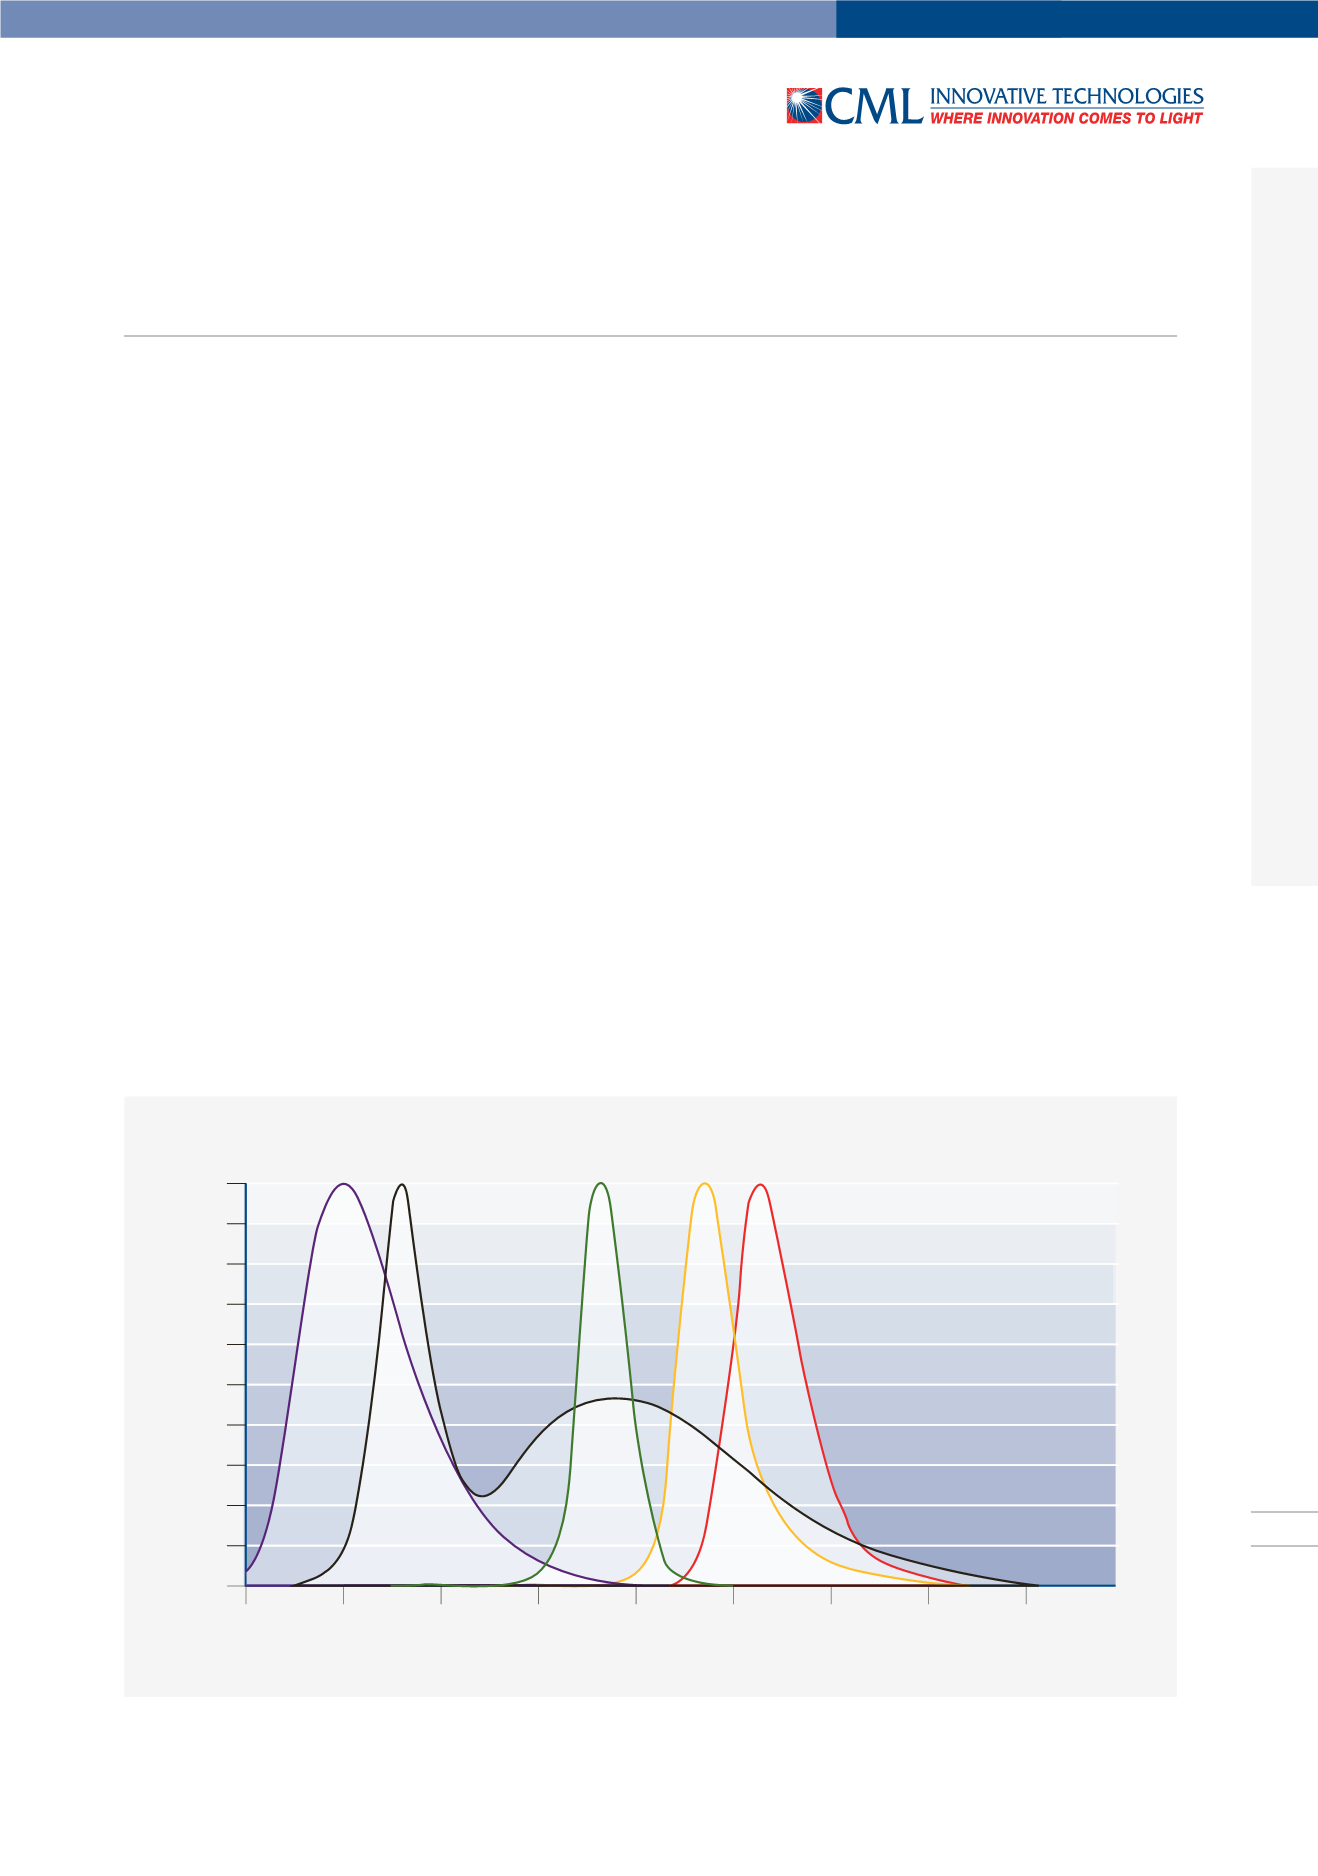
In Abb. 4 sind beispielhaft verschiedene Leuchtdioden mit ihrer
Strahlungsfunktion normiert aufgetragen. Die schwarze Kurve
ist die Strahlungsfunktion einer weiß strahlenden Leuchtdiode.
Erkennbar ist hier das ausgeprägte Maximum im kurzwelligen
Blau und die recht breite Verteilung im Gelb/Orangenen Be-
reich. Dieser Kurvenzug zeigt klar, dass es sich bei der weißen
Leuchtdiode nicht um ein dem Temperaturstrahler kompatibles
Leuchtelement handelt.
Eine weitere wichtige Kenngröße ist die ähnlichste Farbtempe-
ratur (T
n
), die jedoch nur bei der weiß abstrahlenden Leuchtdi-
ode zum Tragen kommt. Die ähnlichste Farbtemperatur ist die-
jenige Temperatur, die einem Temperaturstrahler am nächsten
kommt.
Figure 4 shows the fractional bandwidth of different light-emit-
ting diodes with their spectral energy distribution. The black
curve represents the spectral energy distribution of a white
light-emitting diode.
In this case, the marked maximum in the short-wave blue ran-
ge, and the rather broad distribution in the yellow/orange ran-
ge can be easily identified. This curve clearly shows that the
white light-emitting diode is not illuminantly compatible with
the thermal radiator.
Another important characteristic parameter is the correlated
colour temperature (T
n
), which only applies to the white light-
emitting diode. The correlated colour temperature is the tempe-
rature which comes closest to a thermal radiator.
LEDs
90%
80%
70%
60%
50%
40%
30%
20%
10%
0%
100%
380
430
480
530
580
630
680
730
780
Wellenlänge in nm
Wavelength in nm
Abb. 4 / Figure 4
Relative Intensität /
Relative intensity